A note on lower timeframe confirming price action…
Waiting for lower timeframe confirmation is our main tool to confirm strength within higher timeframe zones, and has really been the key to our trading success. It takes a little time to understand the subtle nuances, however, as each trade is never the same, but once you master the rhythm so to speak, you will be saved from countless unnecessary losing trades. The following is a list of what we look for:
- A break/retest of supply or demand dependent on which way you’re trading.
- A trendline break/retest.
- Buying/selling tails – essentially we look for a cluster of very obvious spikes off of lower timeframe support and resistance levels within the higher timeframe zone.
- Candlestick patterns. We tend to only stick with pin bars and engulfing bars as these have proven to be the most effective.
EUR/USD:
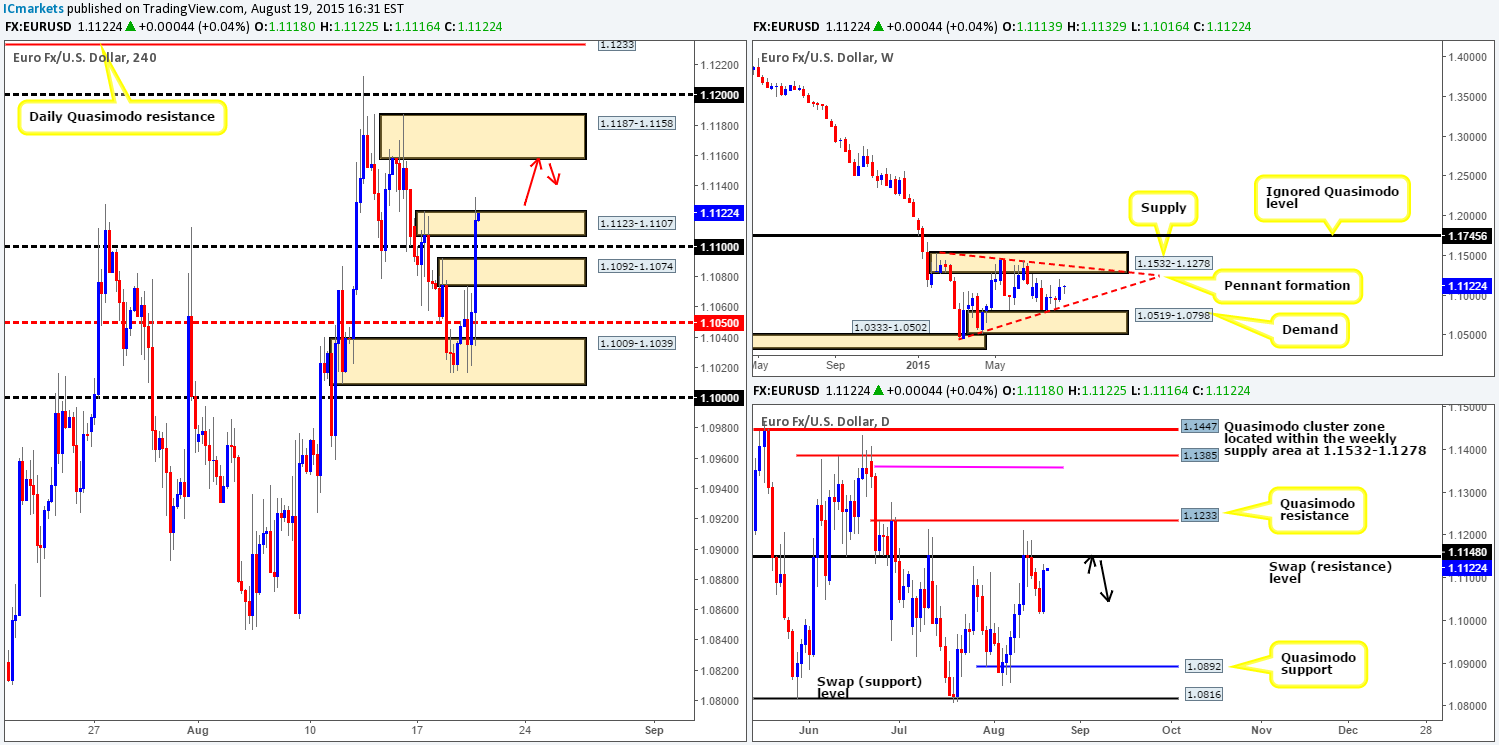
Recent events on the EUR/USD pair show price punched sixty pips higher (open/close) on the back of FOMC minutes yesterday. This move took out several 4hr technical barriers, which, as you can see, ended with a spike/fakeout above 4hr supply at 1.1123-1.1107.
Technically, traders who attempted to fade this 4hr supply area have likely been taken out, thus potentially clearing the path north towards 4hr supply lurking above at 1.1187-1.1158. To that end, here is our take on the market’s most likely path today:
- Buyers will probably continue pushing this market north on the daily timeframe to retest the daily swap (resistance) level at 1.1148 (black arrows).
- This in turn may push prices up to offers sitting around supply on the 4hr timeframe at 1.1187-1.1158 (red arrows). However, we must be prepared for the possibility that a fakeout above this area up to the psychological resistance 1.1200 could take place, so watch where you place stops!
Given the points made above, our team has placed an alert at 1.1154. This will be our cue so to speak to begin watching how the lower timeframes respond to the 4hr supply at 1.1187-1.1158. In the event that we manage to spot a confirmed entry here, we’ll enter short and look to, dependent on how price approached our sell zone of course, take partial profits at around 1.1127.
Levels to watch/live orders:
- Buys: Flat (Stop loss: N/A).
- Sells: 1.1187-1.1158 [Tentative – confirmation required] (Stop loss: dependent on where one confirms this area – watch for a fake higher to 1.1200).
GBP/USD:
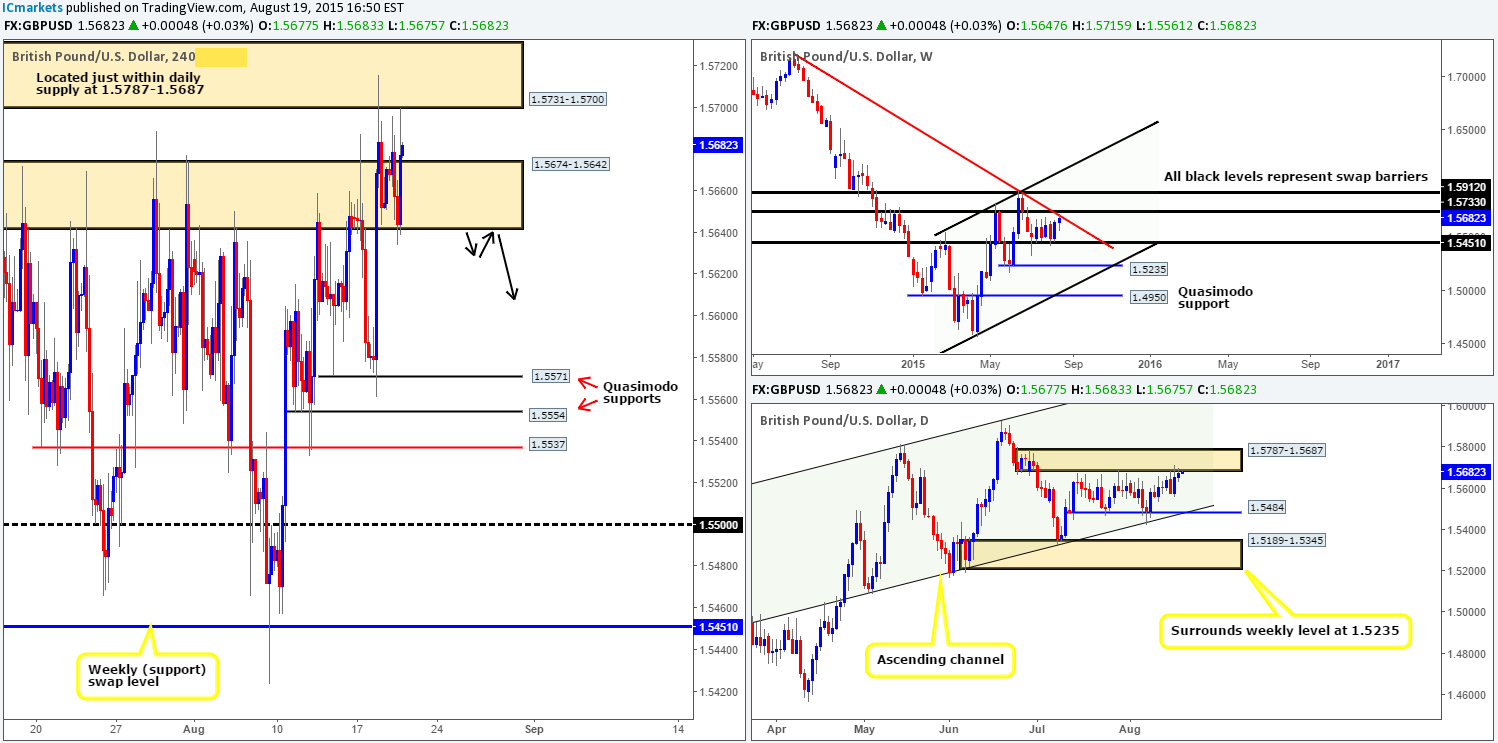
During the course of yesterday’s trade, bids within the recently broken 4hr resistance (turned support) area at 1.5674-1.5642 held firm. This resulted in a bounce north back up to the lower limits of the 4hr supply at 1.5731-1.5700. From a technical standpoint, very little has changed to this pair’s overall structure since yesterday. Therefore, much of the following analysis will remain similar to the previous…
Taking into account that both the weekly and daily timeframes are at distinct resistance points at the moment, our team still favors lower prices for now. The weekly chart shows price currently kissing the underside of the weekly trendline resistance (1.7166), while the daily timeframe shows price respecting a daily resistance area at 1.5787-1.5687.
As such, considering the location of price on the higher timeframe structures (see above), we have no interest in buying this pair right now. Selling on the other hand could be a possibility today/tomorrow should price drive below and retest 1.5674-1.5642 as per the black arrows. If this does occur and we manage to spot lower timeframe selling confirmation following the retest, we’d short this market, targeting 1.5571 – a prominent 4hr Quasimodo support level.
Levels to watch/ live orders:
- Buys: Flat (Stop loss: N/A).
- Sells: Watch for bids at 1.5674-1.5642 to be consumed and then look to enter on a retest at this area (confirmation required).
AUD/USD:
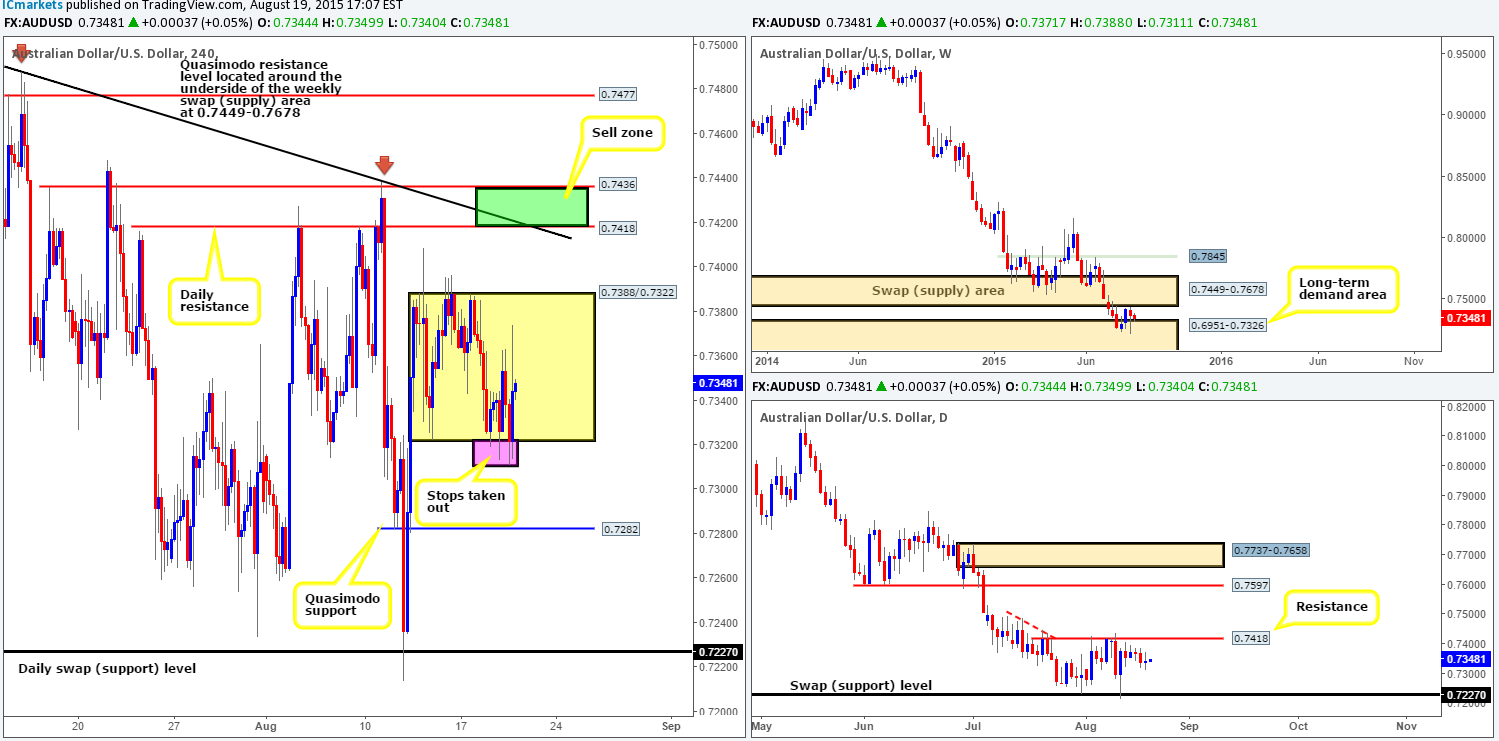
Yesterday’s action in the AUD/USD market shows bids held price above the 4hr range low 0.7322, which pushed the market to highs of 0.7374 on the day. Much like yesterday’s report, one could look to trade the limits of this 4hr range today. We would not advise simply placing pending orders at the extremes and hoping for the best though – this could end with your stops being taken out on a fakeout as we saw yesterday. We do hope that anyone who attempted to trade this lower range limit yesterday managed to weather these fakeouts. This is why we emphasize so much about waiting for the lower timeframes to prove strength exists before jumping in.
A breakout either above or below this 4hr range, however, would be very interesting. Above shows room for price to rally towards 0.7418/0.7436 – a sell zone of ours chalked up a few days ago. A break below this range, nonetheless, potentially opens up the path towards the 4hr Quasimodo support level at 0.7282. Since there is more space below this range than above, one could look to trade the retest following a break lower and target 0.7282 as a first take-profit level…
In spite of the above, when we include the higher timeframes into the mix the picture looks a little different. The downtrend on the weekly timeframe remains strong to say the least. Furthermore, price is trading relatively near to both a daily resistance level at 0.7418, and a weekly swap (supply) area at 0.7449-0.7678. For this reason, our team is still favoring shorts over longs at this time.
Levels to keep an eye on are as follows (lower timeframe confirmation required):
- 0.7388 – the top-side of the 4hr range discussed above.
- 0.7418/0.7436 – a daily resistance level which converges nicely with a 4hr downtrend line taken from the high 0.7494.
- And finally, one could watch for a break below the 4hr range low 0.7322, and look to enter on a retest of this number.
Levels to watch/ live orders:
- Buys: Flat (Stop loss: N/A).
- Sells: 0.7388 [Tentative – confirmation required] (Stop loss: dependent on where one confirms this level) 0.7418/0.7436 [Tentative – confirmation required] (Stop loss: dependent on where one finds confirmation within this area) Watch for bids at 0.7322 to be consumed and then look to enter on a retest of this number (confirmation required).
USD/JPY:
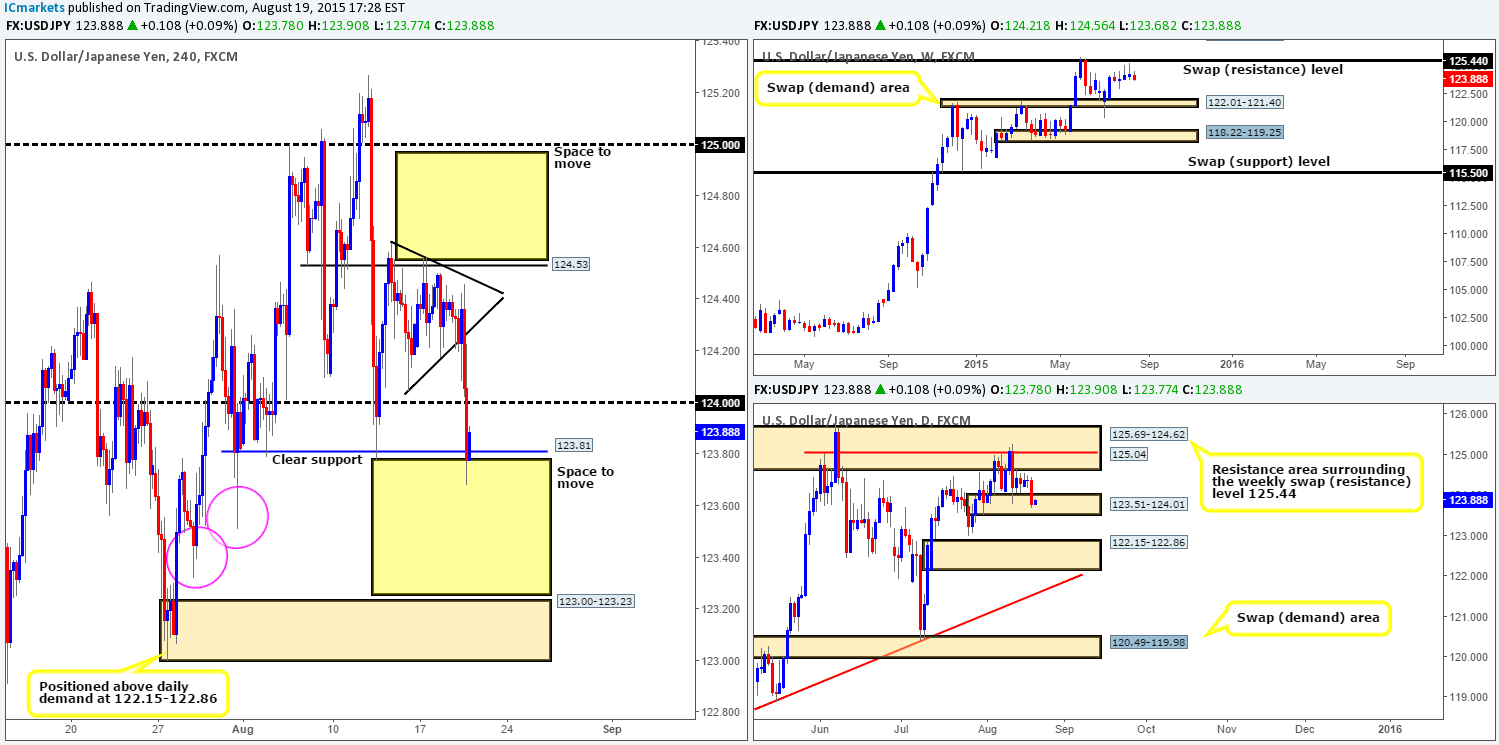
An unrelenting squeeze to the downside took place yesterday as we moved into the U.S. open. Strong offers took out not only the lower limit of the 4hr symmetrical triangle (124.04), but also the psychological support 124.00 as well. On top of that, we also saw price ever so slightly close below a clear 4hr support level coming in at 123.81.
Assuming that the jab below 123.81 was enough to clear out the buyers here and trap any breakout sellers, there could be a potential short trade brewing today. Our rationale behind this idea comes from the following:
- Space for price to move lower between 123.81 and the 4hr demand zone at 123.00-123.23.
- As just mentioned, selling tails printed just below the weekly swap (resistance) level at 125.44. In addition to this, there is also space for price to move lower down to the weekly swap (demand) area at 122.01-121.40.
- The 4hr demand consumption tails painted (pink circles) at 123.51/123.32 suggests that below 124.00, the path south is clear of major bids until the aforementioned 4hr demand area.
Given the points above, our mission objective for today is simple. Watch for lower timeframe selling confirmation in between 123.81/124.00. Should we manage to secure a short position here, we’ll look to target 123.25, just above the aforementioned 4hr demand zone.
Levels to watch/ live orders:
- Buys: Flat (Stop loss: N/A).
- Sells: 124.00/123.81 [Tentative – confirmation required] (Stop loss: dependent on where one manages to find confirmation within this area).
USD/CAD:
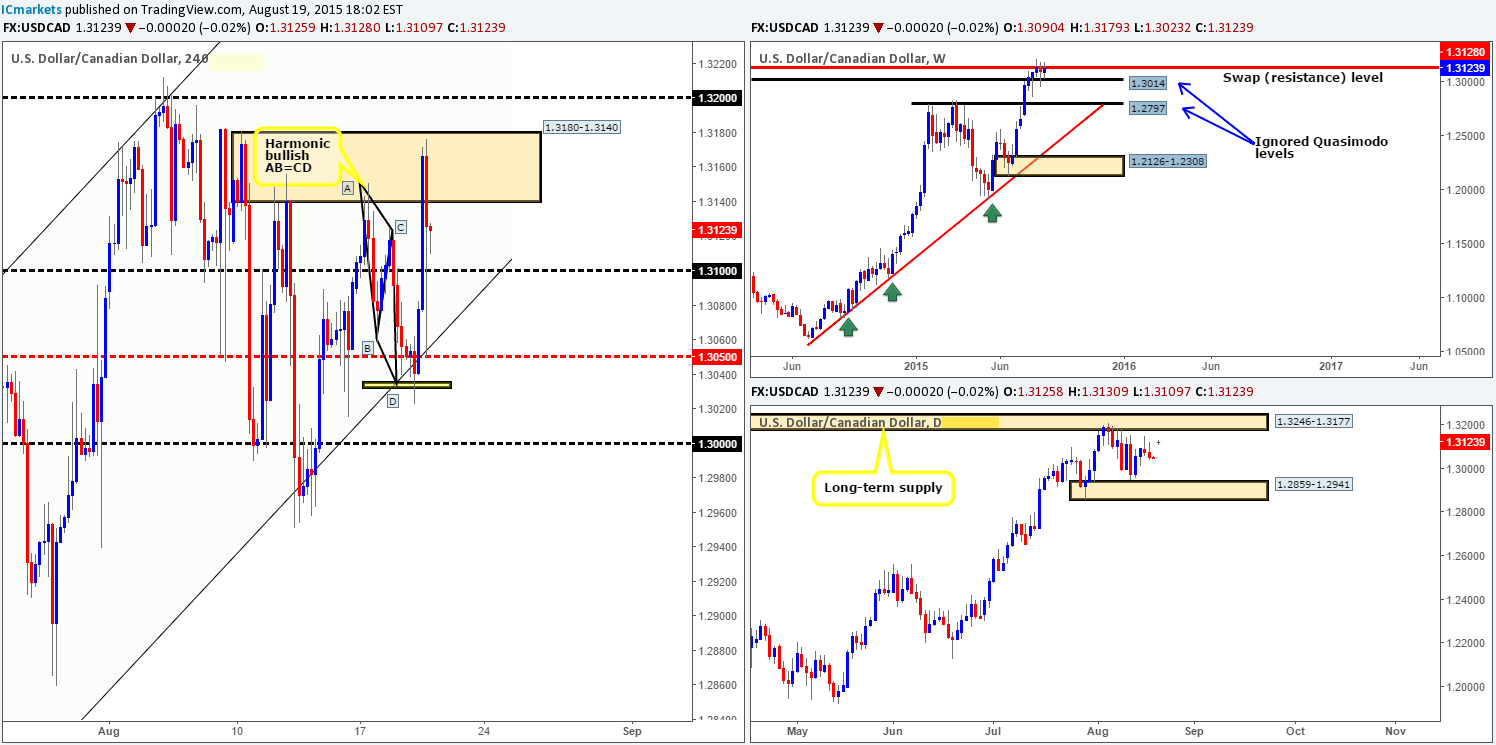
For those who read yesterday’s report on the USD/CAD http://www.icmarkets.com/blog/wednesday-19th-august-daily-technical-outlook-and-review/ you may recall that we mentioned to be prepared for price to rebound from the 4hr Harmonic AB=CD zone (1.3032/1.3035). And rebound it did! Price rallied over 100 pips from this small area, taking out 1.3100 and stabbing deep into 4hr supply coming in at 1.3180-1.3140, which so far is holding this market lower. Well done to any of our readers who managed to lock in some green pips from this move!
Considering the fact that price came within nine pips of the ignored weekly Quasimodo support level (1.3014), and the majority of offers within 4hr supply are likely consumed now, what do we see happening going into today’s sessions? Well, our team believes a small bounce may be seen off of 1.3100. However, buying here is considered a risky trade in our book, as not only is there a weekly resistance level at 1.3128, but also a daily resistance area at 1.3246-1.3177 looming over this level. Therefore, opting to stand on the side lines here may very well be the best path to take.
Levels to watch/ live orders:
- Buys: Flat (Stop loss: N/A).
- Sells: Flat (Stop loss: N/A).
USD/CHF:
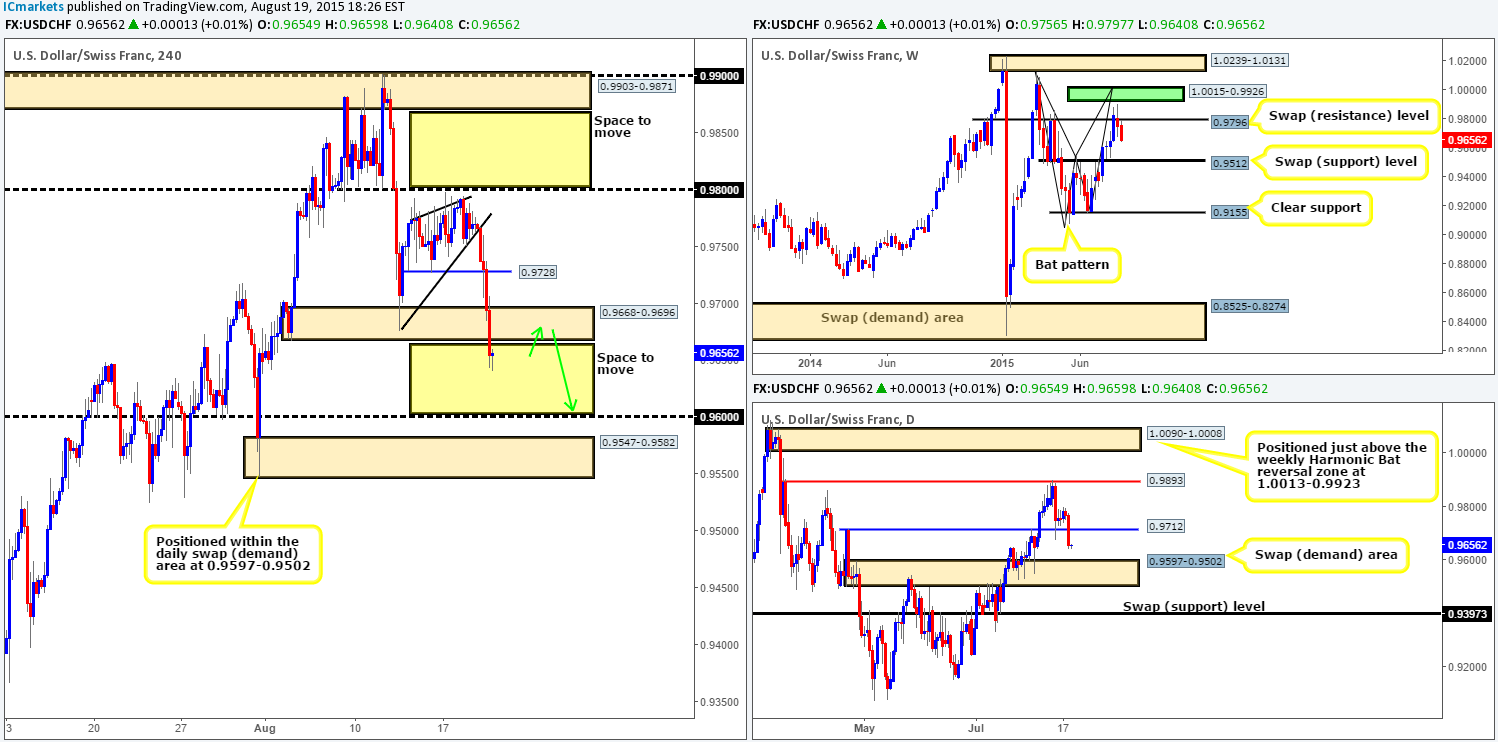
Similar to the USD/JPY, the USD/CHF also fell sharply during yesterday’s trade. As a consequence, price broke below the 4hr bearish wedge pattern (0.9675/0.9773), and took out bids sitting at not only 0.9728, but also 4hr demand at 0.9668-0.9696.
With there being little active demand seen on the 4hr timeframe down until 0.9600, price is (in our opinion) free to continue selling off today. Equally important though, the weekly timeframe also shows room to the downside, as does the daily timeframe after taking out the daily swap (support) level at 0.9712.
That being said, should price retrace and retest the underside of the recently broken 4hr demand area, our plan of attack will consist of looking for lower timeframe sell trades within this zone. If all goes to plan, take-profit targets come in at 0.9600, followed closely by the 4hr demand zone at 0.9547-0.9582 (located within a daily swap (demand) zone at 0.9597-0.9502).
Levels to watch/ live orders:
- Buys: Flat (Stop loss: N/A).
- Sells: 0.9668-0.9696 [Tentative – confirmation required] (Stop loss: dependent on where one confirms this area).
DOW 30:
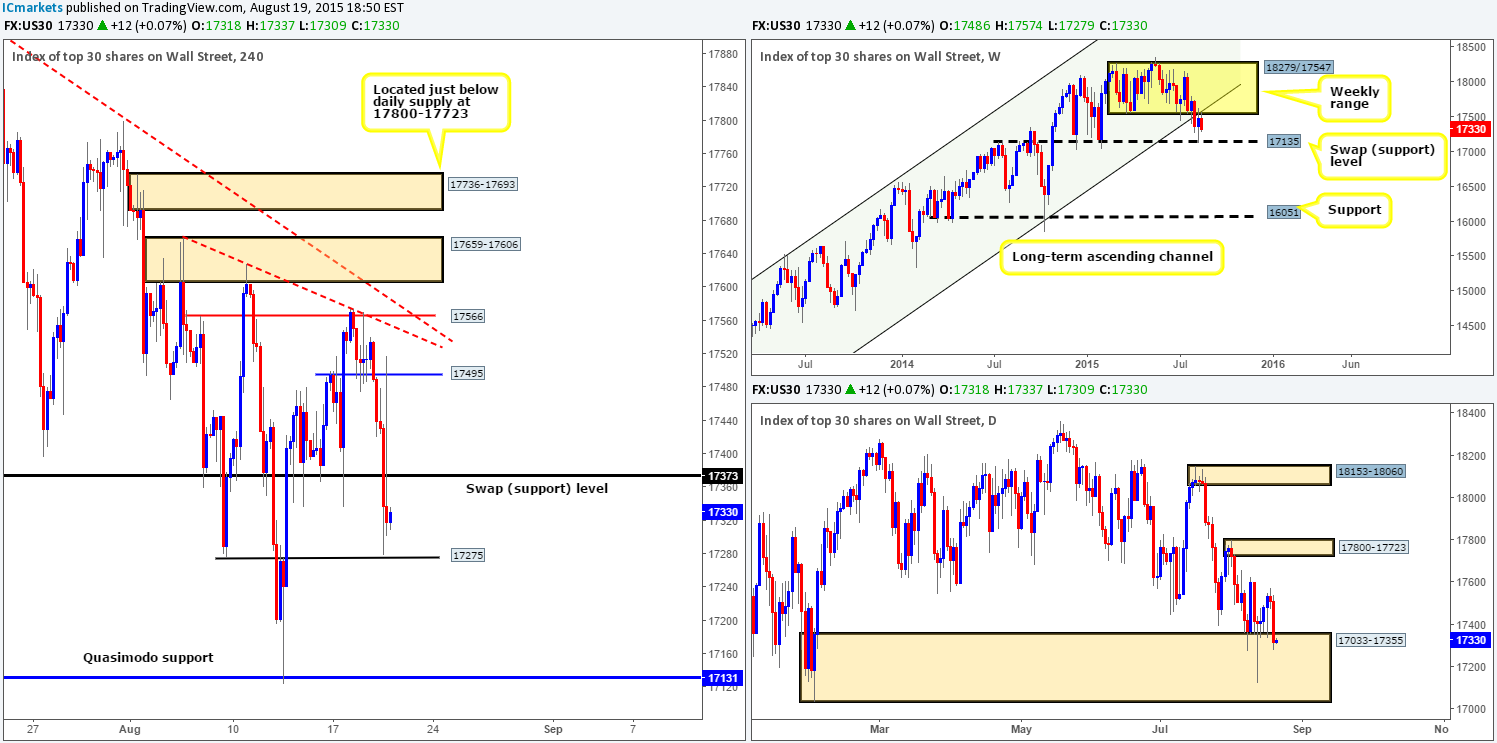
Following on from our previous report http://www.icmarkets.com/blog/wednesday-19th-august-daily-technical-outlook-and-review/ the DOW 30 continued to fall during yesterday’s sessions, taking out both 17495 and the 4hr swap (support) level at 17373 along the way. We were, however, hoping for a retest of 17495 prior to a drop, which unfortunately we never got.
In view of price trading just above a 4hr Quasimodo support level at 17275 now, where do we see this index heading today? Well, since weekly action shows price is trading from the underside of the weekly range low 17547 and its converging weekly ascending channel (resistance –10402), we still feel this market has further to fall yet. However, alongside the 4hr Quasimodo support at 17275, price is also now trading within daily demand at 17033-17355, so one has to be careful shorting this market at this point. The most conservative approach to these obstacles would, in our opinion, be to wait for price to CLOSE below and retest 17275 as resistance. That way, we’d be relatively confident price will head for the 4hr Quasimodo support at 17131 – four points below a weekly swap (support) level at 17135. Granted, by trading the retest of 17275, we would effectively be entering short into daily demand, but let’s not forget that we would also be trading side-by-side with the weekly timeframe!
Levels to watch/ live orders:
- Buys: Flat (Stop loss: N/A).
- Sells: Watch for bids at 17275 to be consumed and then look to enter on a retest of this number (confirmation required).
XAU/USD: (Gold)
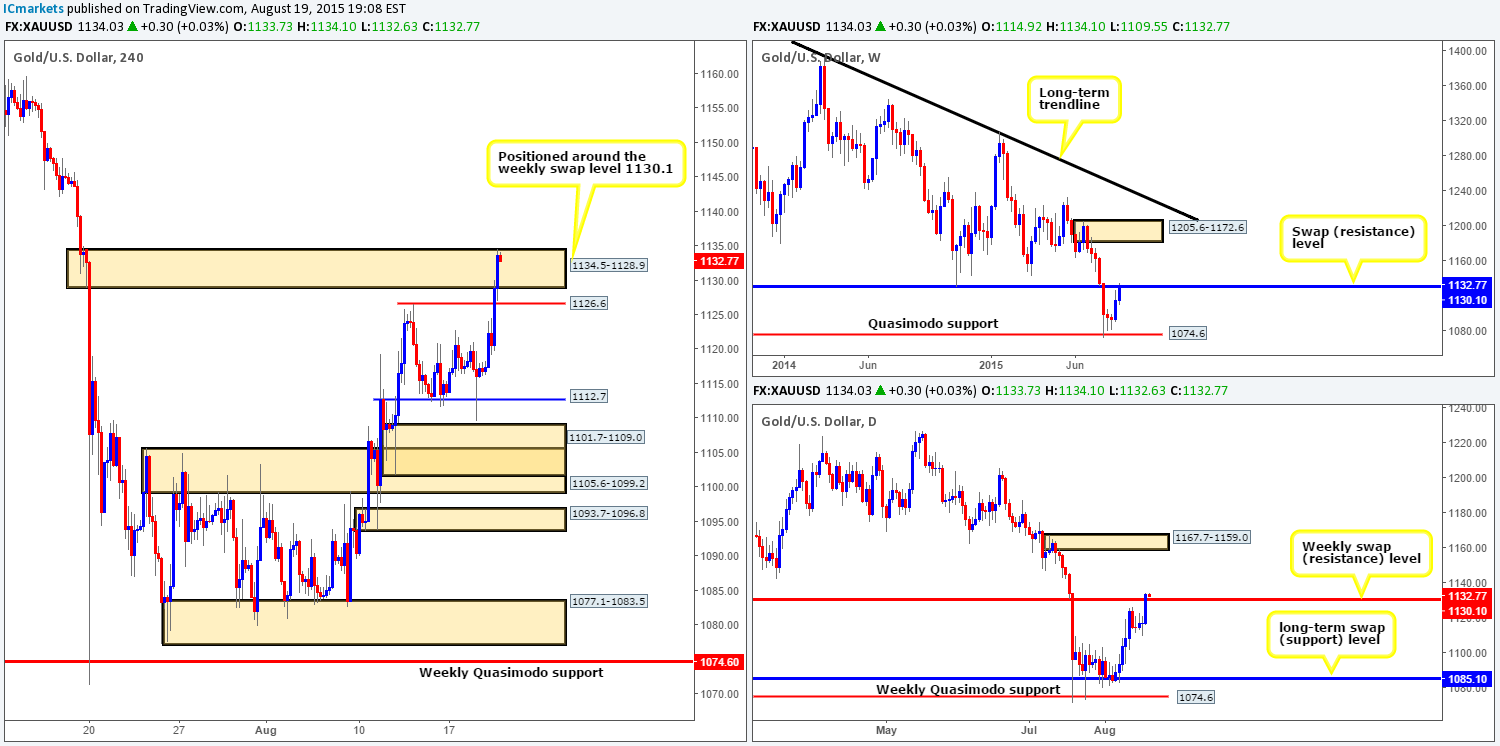
Using a top-down approach this morning, we can see that price on the weekly timeframe is trading just above the weekly swap (resistance) level at 1130.1. Meanwhile on the daily timeframe, price has just recently CLOSED above this weekly level!
Turning our attention to the 4hr timeframe, however, yesterday’s drive higher pushed price deep into a 4hr supply zone coming in at 1134.5-1128.9 (surrounds the aforementioned weekly swap [resistance] level). Although this supply zone is currently holding firm, the ferocity in which price smashed into this area makes us a little nervous about attempting to short here today.
Given the points made above, we’re not really confident how price will react today. As such, we’ve decided to remain flat for the time being – hopefully this time tomorrow we’ll have more information on Gold’s next move.
Best rule of trading is to ALWAYS act in your own best interest! If you’re unsure, stay away!
Levels to watch/ live orders:
- Buys: Flat (Stop loss: N/A).
- Sells: Flat (Stop loss: N/A).


