A note on lower timeframe confirming price action…
Waiting for lower timeframe confirmation is our main tool to confirm strength within higher timeframe zones, and has really been the key to our trading success. It takes a little time to understand the subtle nuances, however, as each trade is never the same, but once you master the rhythm so to speak, you will be saved from countless unnecessary losing trades. The following is a list of what we look for:
· A break/retest of supply or demand dependent on which way you’re trading.
· A trendline break/retest.
· Buying/selling tails/wicks – essentially we look for a cluster of very obvious spikes off of lower timeframe support and resistance levels within the higher timeframe zone.
· Candlestick patterns. We tend to only stick with pin bars and engulfing bars as these have proven to be the most effective.
We search for lower timeframe confirmation between the M15 and H1 timeframes, since most of our higher-timeframe areas begin with the H4. Stops are usually placed 5-10 pips beyond confirming structures.
EUR/USD:
Weekly gain/loss: – 126 pips
Weekly closing price: 1.1192
Weekly opening price: 1.1175
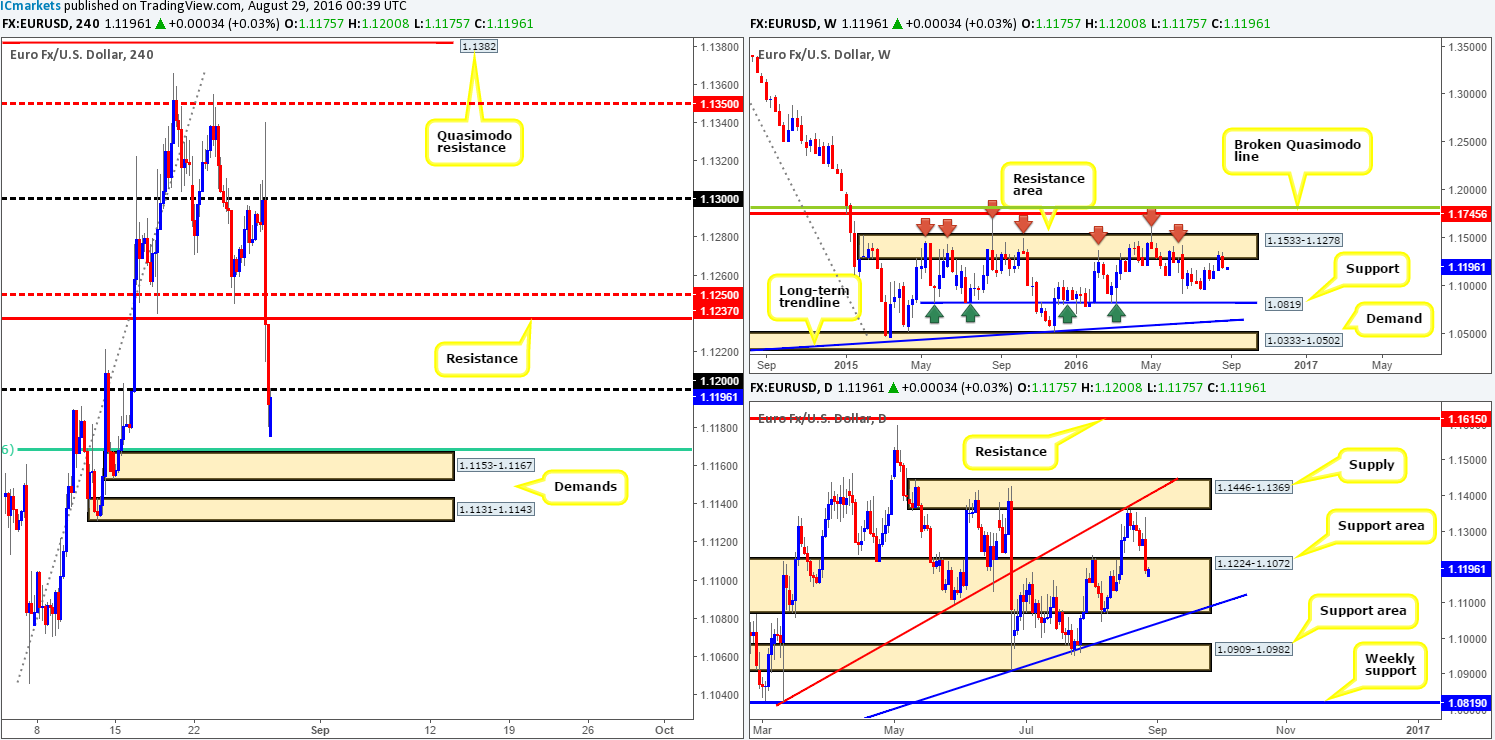
Weekly view: The past week saw the EUR reverse from the underside of a major resistance area drawn from 1.1533-1.1278. In that this zone has managed to cap upside since May 2015, further selling is likely on the cards. The next downside target to have an eye on this week falls in around the 1.0970 region, followed closely by a major support seen at 1.0819.
Daily view: Despite what we’re seeing on the weekly chart, the daily picture shows price recently drove into a support area coming in at 1.1224-1.1072, which has been active since early 2015! This suggests that we may see some buying pressure come into the market from here this week.
H4 view: A quick recap of Friday’s session on the H4 chart shows that the single currency aggressively sold off against its US counterpart, following Janet Yellen’s speech. Several H4 tech supports were wiped out, with the pair closing the week just below the 1.12 handle, which, as you can see, was recently retested as resistance.
Direction for the week: Seeing as how there is somewhat of conflict being seen between the weekly and daily structures right now, medium-term direction is limited in our opinion.
Direction for today: With 1.12 holding as resistance at the moment, the next area on the hit list is likely to be the H4 demand registered at 1.1153-1.1167 (merges with a H4 61.8% Fib level at 1.1168), followed closely by the H4 demand seen at 1.1131-1.1143.
Our suggestions: One could look to trade long from the above said H4 demand barriers today. However, although both zones inhabit the above said daily support area, let’s not forget what the weekly chart is telling us (see above). Therefore, we would not recommend simply buying the H4 demand zones at market, rather we’d advise waiting for lower timeframe confirmation to form prior to pulling the trigger (see the top of this report).
Levels to watch/live orders:
- Buys: 1.1153-1.1167 [Tentative – confirmation required] (Stop loss: dependent on where one confirms this area). 1.1131-1.1143 [Tentative – confirmation required] (Stop loss: dependent on where one confirms this area).
- Sells: Flat (Stop loss: N/A).
GBP/USD:
Weekly gain/loss: – 56 pips
Weekly closing price: 1.3128
Weekly opening price: 1.3109
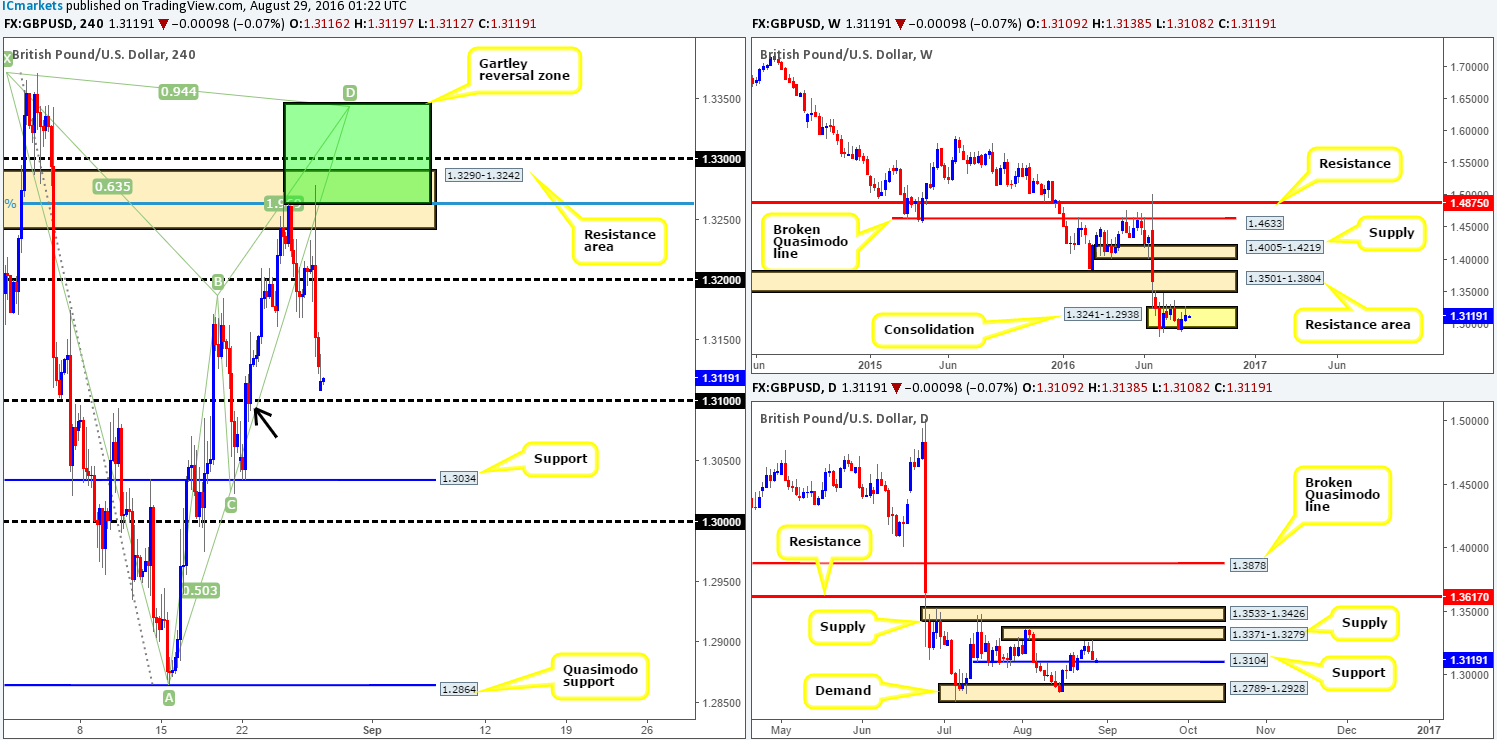
Weekly view: Following a break through the support area seen at 1.3501-1.3804 (now acting resistance area), cable entered into a phase of consolidation between 1.3241-1.2938. While there’s a possibility that price could spike north to retest the 1.3501-1.3804 area, the trend on this pair is clearly pointing south so a continuation move lower is more likely in our estimation.
Daily view: Supply at 1.3371-1.3279, as you can see, held the pair lower last week, consequently forcing price to close the week just ahead of a support line coming in at 1.3104. A breakdown through this level could prompt further selling down to demand seen at 1.2789-1.2928.
H4 view: With Fed Chair Janet Yellen noting that the case for a rate hike has strengthened, the GBP initially spiked to highs of 1.3278, but then sharply fell to lows of 1.3122.
Direction for the week: Given daily support at 1.3104 is now seen within striking distance, we may see price reverse from here and trim last week’s losses.
Direction for today: Along with the daily support level at 1.3104, we also have the psychological barrier 1.31 to play with. 1.13 was used to propel prices higher at the beginning of last week’s trading (see black arrow). This – coupled with it merging closely with the daily support, suggests price will highly likely find some support here and rally higher.
Our suggestions: Quite simply, watch for a bounce from the 1.31 mark today. To avoid the dreaded fakeout which is so common around psychological numbers, we would suggest entering long if and only if one is able to pin down a lower timeframe buy signal. For lower timeframe entry techniques please see the top of this report.
Levels to watch/live orders:
- Buys: 1.31 region [Tentative – confirmation required] (Stop loss: dependent on where one confirms this area).
- Sells: Flat (Stop loss: N/A).
AUD/USD:
Weekly gain/loss: – 66 pips
Weekly closing price: 0.7558
Weekly opening price: 0.7556
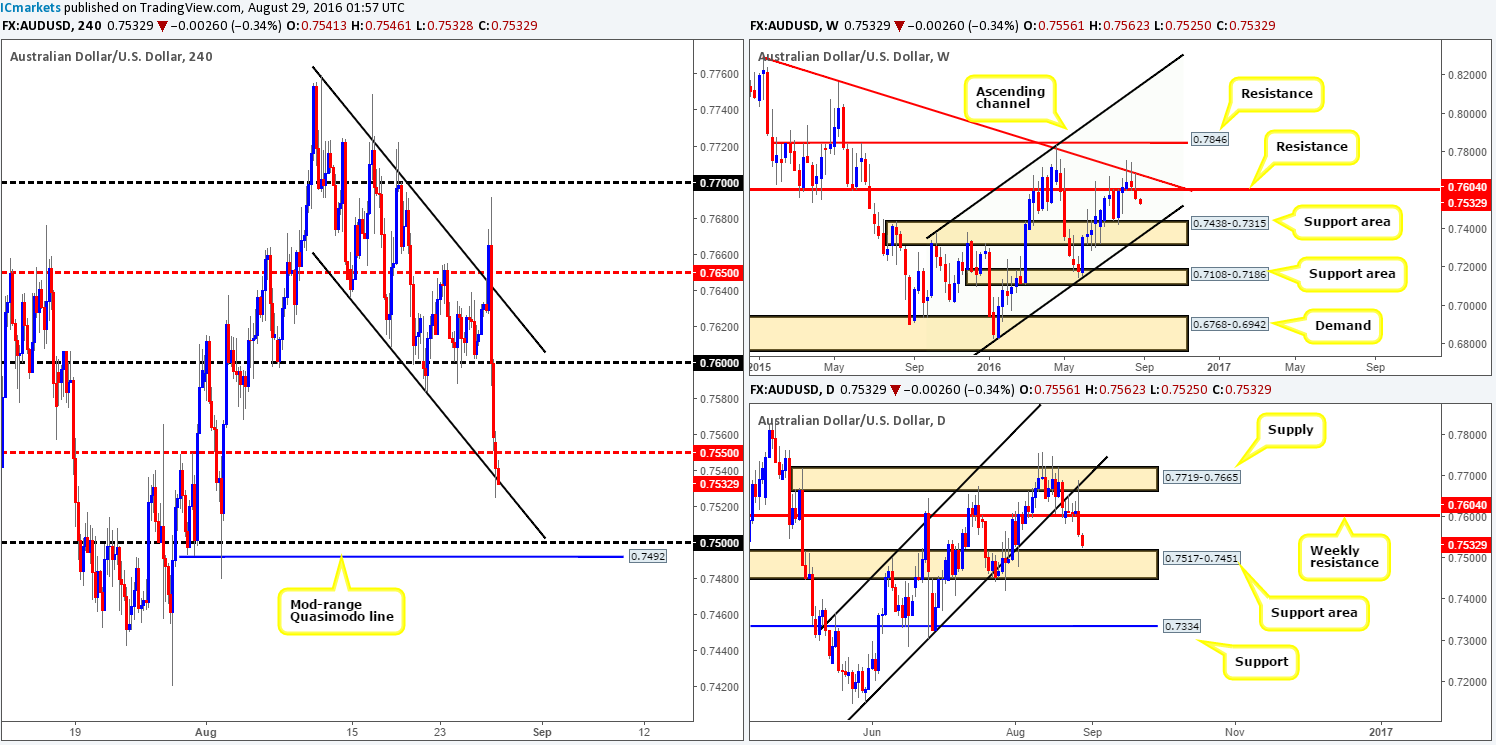
Weekly view: As can be seen from the weekly chart, last week’s movement tagged the trendline resistance extended from the high 0.8295, ending the week closing below support at 0.7604 (now acting resistance). In the event that the bears remain dominant here, there’s a possibility that we may see price stretch down to a support area logged in at 0.7438-0.7315.
Daily view: From this angle, however, the commodity currency recently came within touching distance of connecting with the top edge of a support area penciled in at 0.7517-0.7451. With this area having been a considerable zone since March 24th, a bounce from this region is likely which could potentially send prices back up to the weekly resistance level mentioned above at 0.7604.
H4 view: On the back of Janet Yellen’s comments on Friday, the Aussie whipsawed through the H4 channel resistance taken from the high 0.7759 and tumbled to lows of 0.7551 on the day.
Direction for the week: Weekly action suggests lower prices are possible, whereas down on the daily chart, price is trading within a cat’s whisker of a major daily support area! With this being the case, direction for this pair is fairly limited given the higher-timeframe structures.
Direction for today: Early on this morning, we can see that the H4 candles broke through the H4 mid-way support 0.7550 and touched gloves with the H4 channel support line extended from the low 0.7636. While there is a possibility that price may fake though this line to connect with the top edge of the daily support area at 0.7517, we feel there’s a good chance that this market will see a reversal from this region today, possibly back up to the 0.76 mark.
Our suggestions: Watch for confirmed lower timeframe entries (see the top of this report) into this market between the H4 channel support line and the top-side of the aforementioned daily support area. The reason lower timeframe confirmation is required simply comes down to not knowing how deep the Aussie will drive into the daily support area!
Levels to watch/live orders:
- Buys: Watch for lower timeframe (confirmed) entries between the current H4 channel support line and the top edge of the daily support area at 0.7517 (Stop loss: dependent on where one confirms this area).
- Sells: Flat (Stop loss: N/A).


