A note on lower timeframe confirming price action…
Waiting for lower timeframe confirmation is our main tool to confirm strength within higher timeframe zones, and has really been the key to our trading success. It takes a little time to understand the subtle nuances, however, as each trade is never the same, but once you master the rhythm so to speak, you will be saved from countless unnecessary losing trades. The following is a list of what we look for:
- A break/retest of supply or demand dependent on which way you’re trading.
- A trendline break/retest.
- Buying/selling tails/wicks – essentially we look for a cluster of very obvious spikes off of lower timeframe support and resistance levels within the higher timeframe zone.
- Candlestick patterns. We tend to only stick with pin bars and engulfing bars as these have proven to be the most effective.
For us, lower timeframe confirmation starts on the M15 and finishes up on the H1, since most of our higher timeframe areas begin with the H4. Stops usually placed 5-10 pips beyond your confirming structures.
EUR/USD:
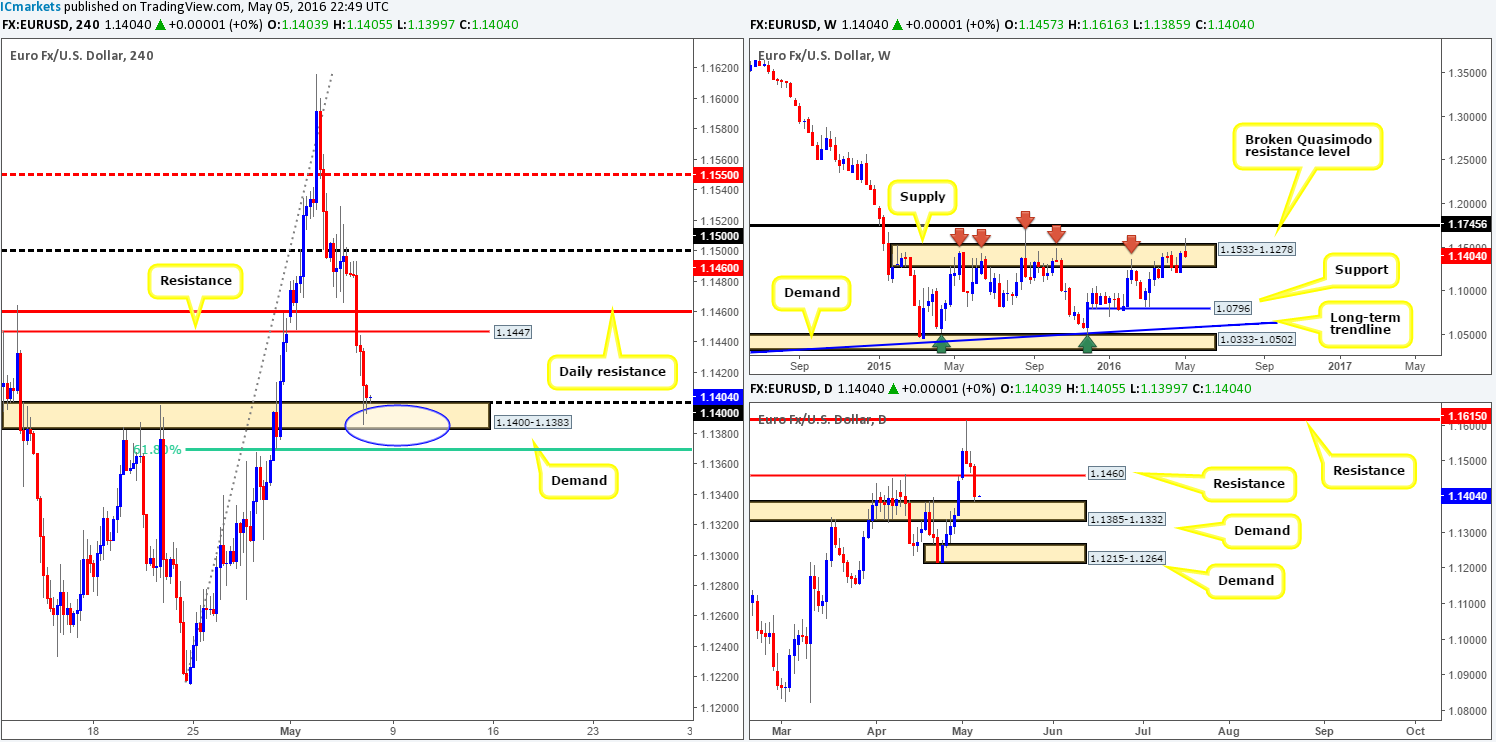
Yesterday’s London open saw the single currency resume its decline against the U.S. dollar, losing around eighty pips on the day. Both daily support at 1.1460 and H4 support at 1.1447 were taken out (now acting resistances), leaving the EUR free to shake hands with H4 demand coming in at 1.1400-1.1383. Due to this barrier fusing with psychological support 1.1400 and located nearby a 61.8% H4 Fibonacci support at 1.1368, as well as sitting on top of a daily demand base carved from 1.1385-1.1332 (blue circle), longs could be a possibility today.
Before we all get too excited though, the weekly chart shows that price resides within a major area of weekly supply chalked up at 1.1533-1.1278. This zone has held price lower since May 2015 so it is certainly not a barrier to be ignored.
So let’s just run through what we have here: Weekly is trading from supply and both the Daily and H4 are currently crossing paths with demand. In view of this, we feel a bounce could be seen from the H4 area highlighted within the blue circle (see above) today, but the most we’d expect from this move is H4 resistance 1.1447 due to what we’re seeing on the weekly picture (see above). In addition to this, we would highly recommend waiting for lower timeframe confirmation to form before risking capital here (for confirmation techniques, please see the top of this report), as placing oneself on the wrong side of weekly flow is quite a risky play in our book. Finally, due to the mighty NFP taking the stage later on today, technicals might be sidelined during this time, so remain vigilant!
Levels to watch/live orders:
- Buys: 1.1368/1.1400 [Tentative – confirmation required] (Stop loss: dependent on where one confirms this area).
- Sells: Flat (Stop loss: N/A).
GBP/USD:
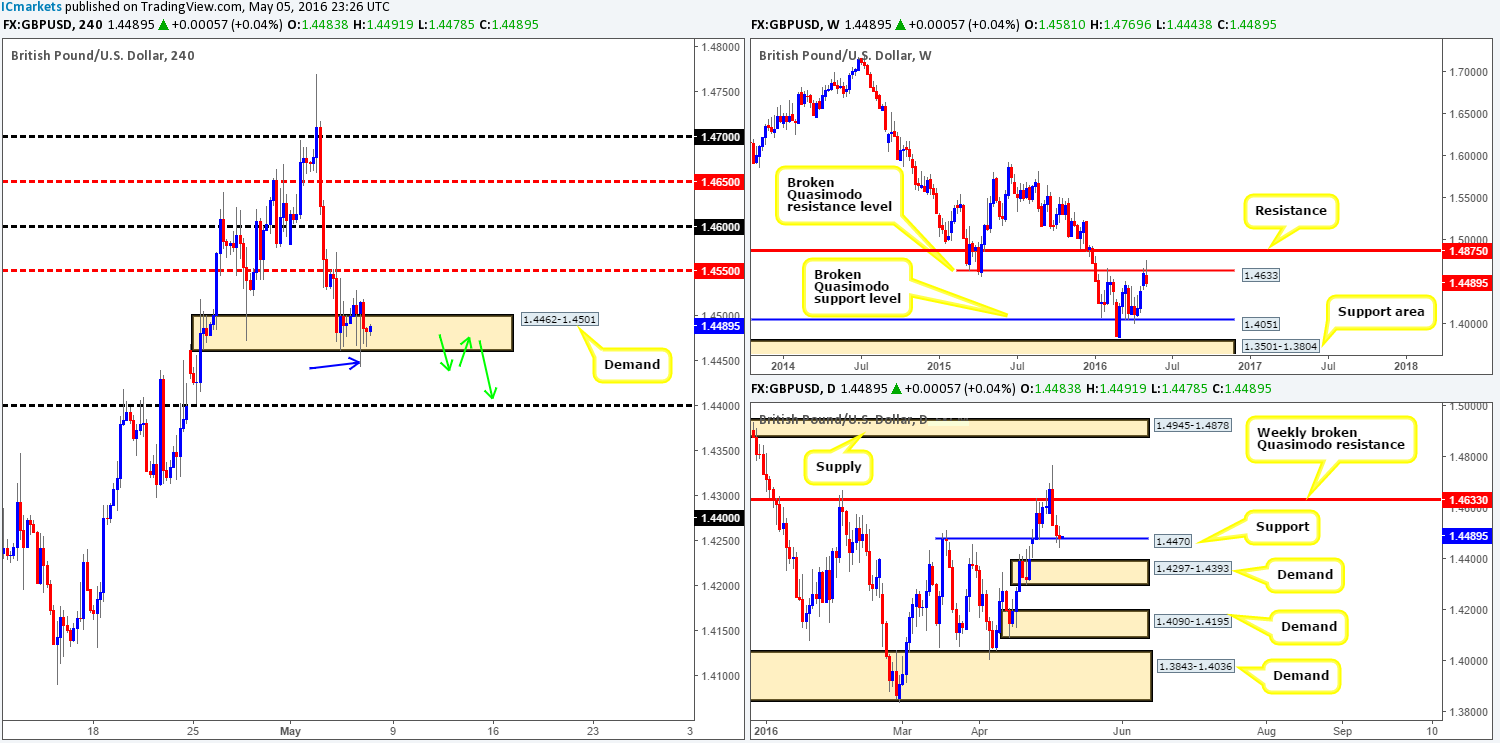
Beginning with a quick look at the weekly chart this morning reveals that Cable continues to reflect a more bearish stance, as the weekly broken Quasimodo resistance line at 1.4633 (BQRL) remains intact. Our next downside target from this line falls in around the weekly broken Quasimodo support at 1.4051. Despite this, lower down the scale daily action is seen trading from daily support penciled in at 1.4470. Uncertainty looks to be brewing around this region, nonetheless, due to a clear-cut indecision candle forming yesterday.
Stepping across the pond to the H4 chart, trading was relatively limited during yesterday’s sessions with neither side gaining much ground. Nevertheless, the whipsaw through H4 demand at 1.4462-1.4501 (blue arrow) seen mid-way through the morning London session likely triggered a truckload of stops and may have cleared the path south down to the 1.4400 handle (essentially the top-side of daily demand [seen below the aforementioned daily support] at 1.4297-1.4393). Therefore, with the weekly chart indicating selling may be the best path to take, as well as the daily chart showing uncertainty around support and now H4 candle action possibly clearing the runway for lower prices, selling seems the more logical route.
In order for us to become sellers in this market, a break below and retest of the current H4 demand would need to take place (green arrows) in order for us to target 1.4400. Whether one waits for lower timeframe confirmation or not here is down to the individual trader.
Levels to watch/live orders:
- Buys: Flat (Stop loss: N/A).
- Sells: Watch for price to close below 1.4462-1.4501 and look to trade any retest seen thereafter (lower timeframe confirmation preferred).
AUD/USD:
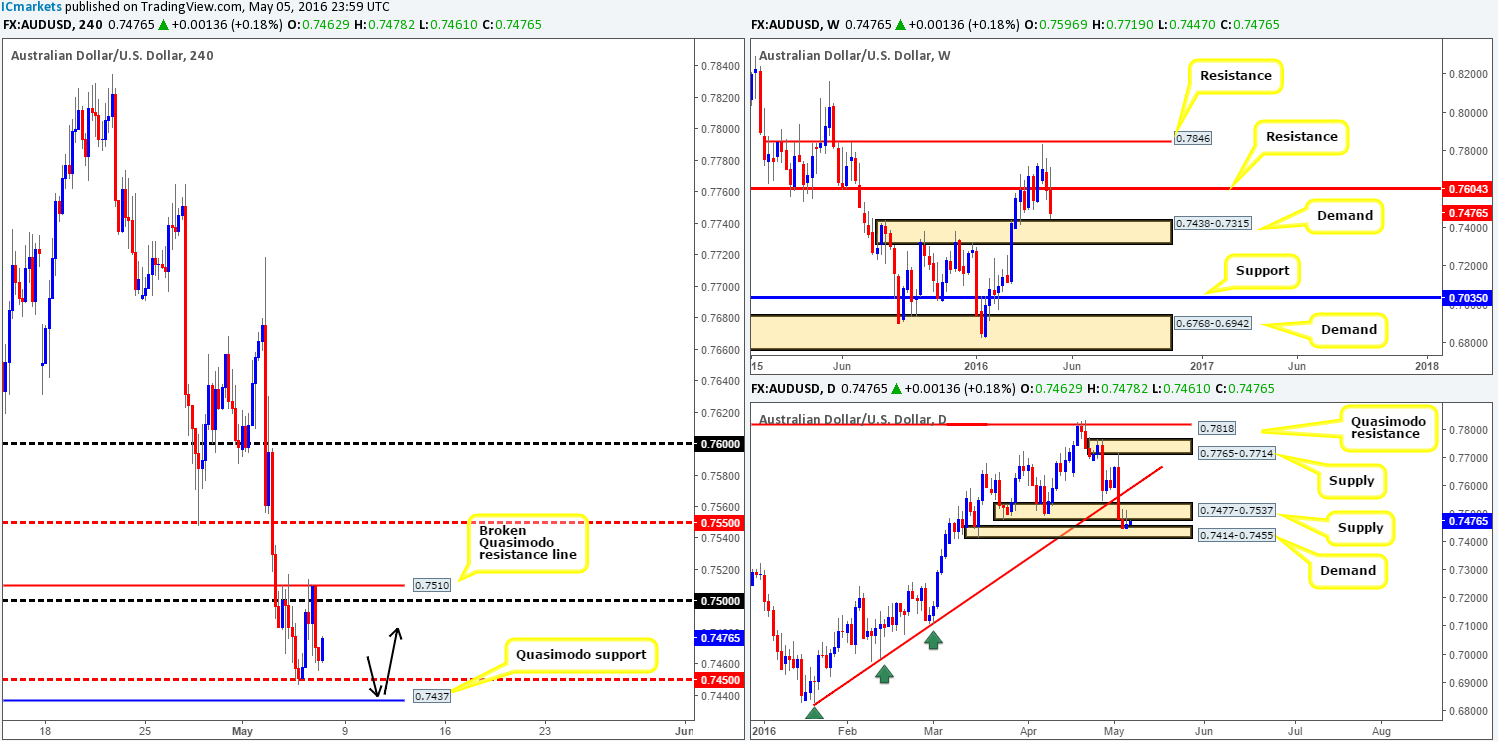
Feeding off of a bounce from the H4 mid-way support 0.7450 the pair broke above the 0.7500 handle early on in yesterday’s European open. As you can see though, the buyers failed to hold on to these gains as price crashed back to lows of 0.7455. Despite this flurry of buying and selling the commodity currency closed the day with little change, resulting in much of the following analysis echoing thoughts put forward in Thursday’s report.
From the top, the weekly chart remains trading within touching distance of weekly demand carved from 0.7438-0.7315. Along the same vein, a small daily demand zone at 0.7414-0.7455 was brought into play on Wednesday. However, with overhead daily supply smothering this demand at 0.7477-0.7537, the buyers may struggle. Looking over to the H4 chart, we can see that price continues to hold above 0.7450, but it is not this level we’re interested in it’s the H4 Quasimodo support level drawn from 0.7437. This is due to it converging beautifully with the top-side of the weekly demand zone mentioned above at 0.7438-0.7315.
We still have our pending buy order set at 0.7438 with a stop placed below the current daily demand at 0.7410, but if it is not triggered soon we’ll cancel it due to the NFP taking the limelight later on today. Should the order fill today, we’ll want to see price strike the 0.7500 line before considering taking partial profits and reducing risk.
Levels to watch/live orders:
- Buys: 0.7438 [Pending order] (Stop loss: 0.7410).
- Sells: Flat (Stop loss: N/A).
USD/JPY:
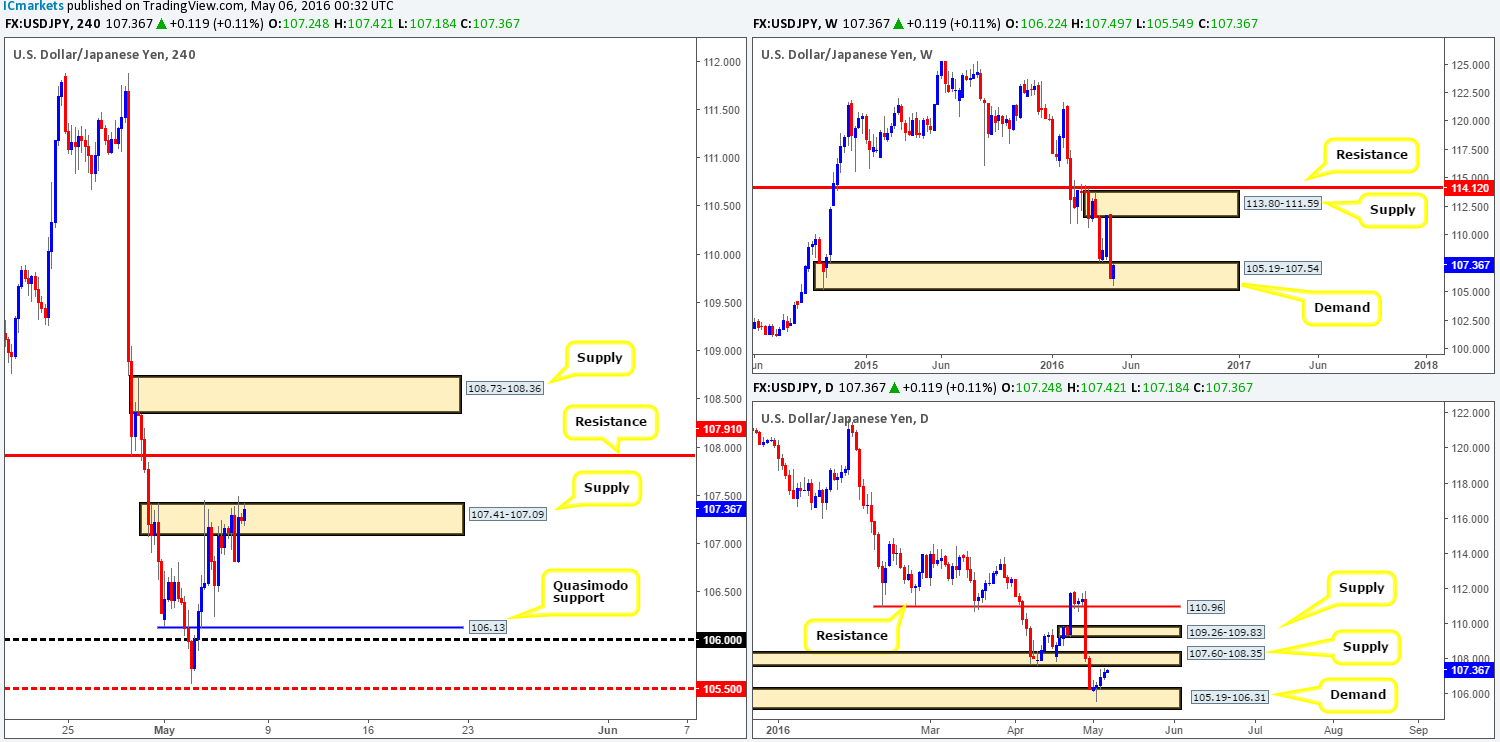
In recent H4 trade, the USD/JPY sported a more subtle approach as price spent the day consolidating between 107.29/106.82 around H4 supply drawn from 107.41-107.09. Now in previous reports, we were hoping for a pullback to the H4 Quasimodo support barrier at 106.13 to enter long. This does not look like it is going to happen since price will likely continue to consolidate within yesterday’s range ahead of today’s NFP.
Technically, we see the market trading from demand on the weekly timeframe at 105.19-107.54, and within shouting distance of a daily supply coming in at 107.60-108.35. In light of this and the volatility expected in today’s markets the areas we have jotted down going into today’s sessions are as follows:
- H4 resistance at 107.91 (seen located within daily supply at 107.60-108.35).
- H4 supply at 108.73-108.36 (positioned just above the aforementioned daily supply).
- H4 Quasimodo support line at 106.13 (housed within daily demand seen at 105.19-106.31).
Levels to watch/live orders:
- Buys: 106.13 region [Tentative – confirmation required] (Stop loss: dependent on where one confirms this area).
- Sells: 107.91 region [Tentative – confirmation required] (Stop loss: dependent on where one confirms this area). 108.73-108.36 [Tentative – confirmation required] (Stop loss: dependent on where one confirms this area).
USD/CAD:
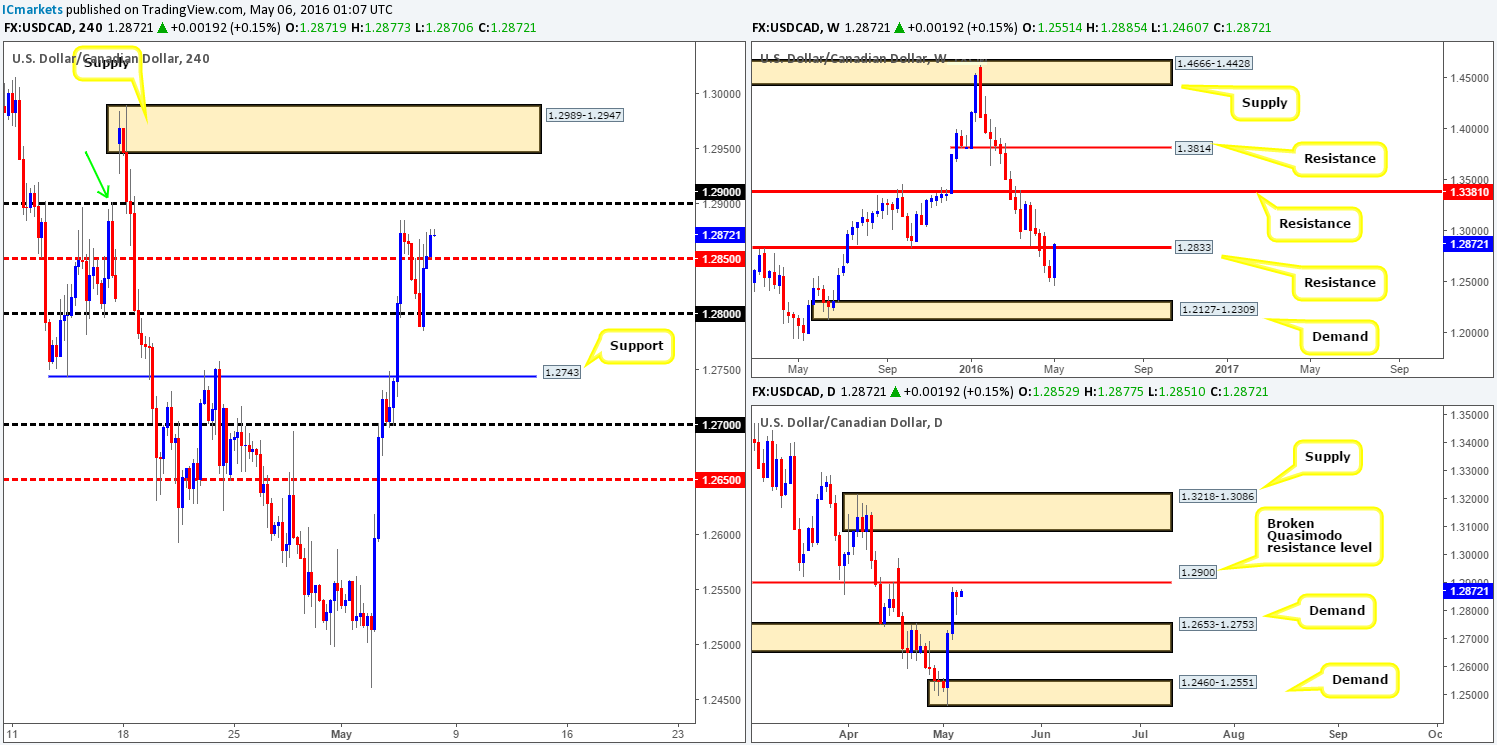
Using a top-down approach this morning, weekly price continues to trade a few pips above weekly resistance at 1.2833. As highlighted in our previous report, this is in no way a bullish signal for us since all this could really be is a fakeout above this line before driving lower! Scaling down to the daily chart, the Loonie is seen lurking a few pips below a broken daily Quasimodo resistance line at 1.2900. Just taking into account what we’ve noted on these two timeframes, we are sure you’ll agree there is a strong bearish scent forming here.
Turning our attention to the H4 chart, however, the USD/CAD is once again trading above the H4 mid-way resistance 1.2850. With the 1.2900 handle seen hovering a few pips above (also represents the broken daily Quasimodo resistance level and converges nicely with a H4 Quasimodo left shoulder seen marked with a green arrow), followed closely by a H4 supply carved from 1.2989-1.2947, these areas are likely going to be key barriers in today’s trading given the higher-timeframe picture (see above in bold). As such, we would, with the right lower timeframe response from either hurdle (for confirmation techniques, please see the top of this report), look to short this market. On a final note, due to the mighty NFP taking the stage later on today, technicals might be sidelined during this time so do remain vigilant!
Levels to watch/live orders:
- Buys: Flat (Stop loss: N/A).
- Sells: 1.2900 region [Tentative – confirmation required] (Stop loss: dependent on where one confirms this area). 1.2989-1.2947 [Tentative – confirmation required] (Stop loss: dependent on where one confirms this area).
USD/CHF:
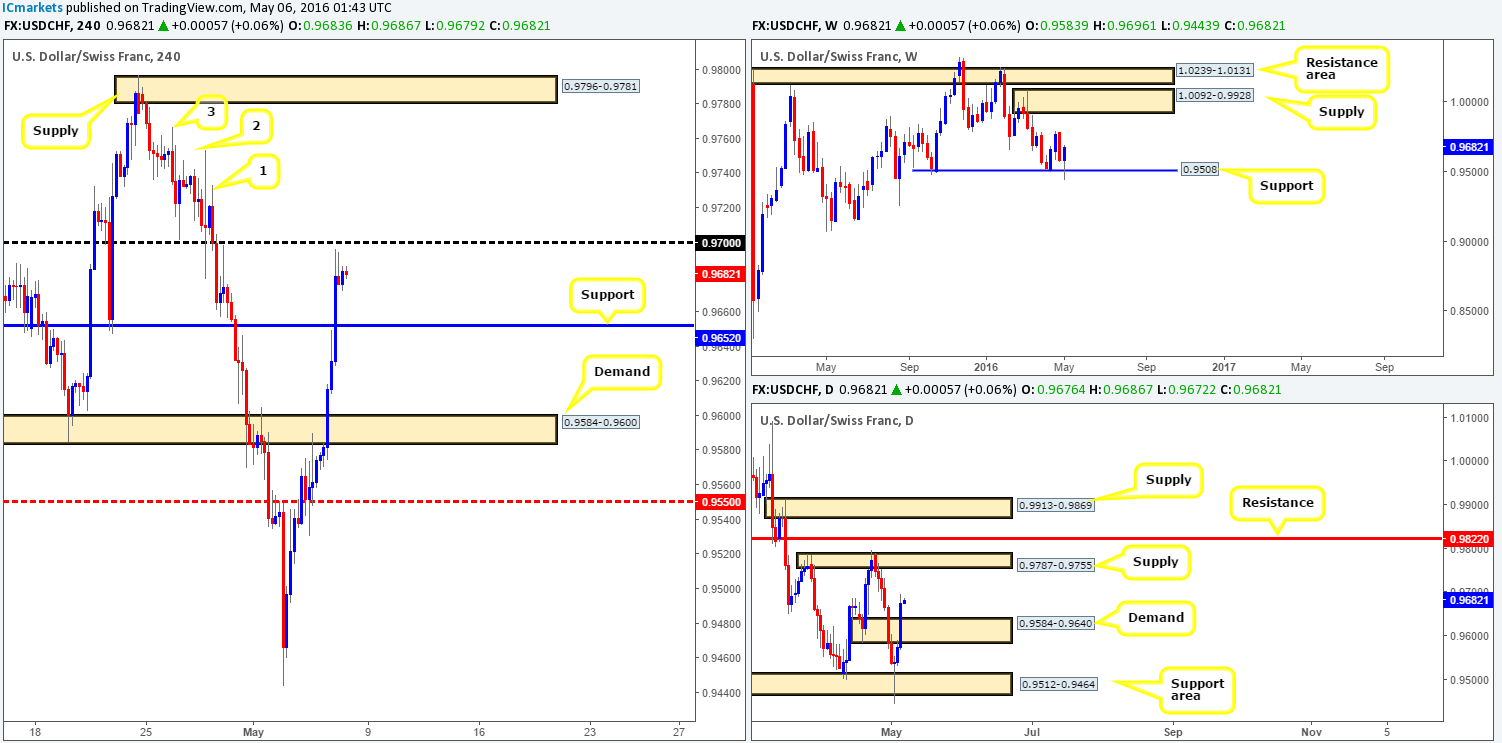
An unrelenting squeeze to the upside took place yesterday, taking out several H4 technical resistances and ending the day topping out just ahead of the 0.9700 handle. From a technical standpoint, this recent surge in buying should not really have come as much of surprise, owing to price recently connecting with weekly support at 0.9508! Lower down on the daily chart, daily supply at 0.9584-0.9640 was, however, wiped out yesterday, potentially clearing the river north for a rally up to daily supply coming in at 0.9787-0.9755.
So, in view of the current structure and bearing in mind that today is the all-important nonfarm payrolls release, what’s likely in store for this pair? Well, we feel the 0.9700 resistance line will not hold well today. Of course, a bounce will likely be seen, but a reversal we believe is doubtful. The reason for why, apart from the clear bullish direction being seen on the higher-timeframe picture right now (see above), is there’s little active supply seen above 0.9700 (supply consumption wicks [1-3] 0.9766/0.9753/0.9733) until H4 supply coming in at 0.9796-0.9781 (positioned within the extremes of the daily supply mentioned above at 0.9787-0.9755). Therefore, should a close above and retest of 0.9700 be seen before the NFP shenanigans begin, followed by some sort of lower timeframe buy signal, we’d look to long this market targeting the aforementioned H4 supply. In regards to confirmation, this could be in the form of an engulf of supply and subsequent retest as demand, a break/retest of a trendline or simply a collection of buying tails around a lower-timeframe support.
Levels to watch/live orders:
- Buys: Watch for price to close above 0.9700 and look to trade any retest seen thereafter (lower timeframe confirmation required).
- Sells: Flat (Stop loss: N/A).
DOW 30:
(Slight change in structure)
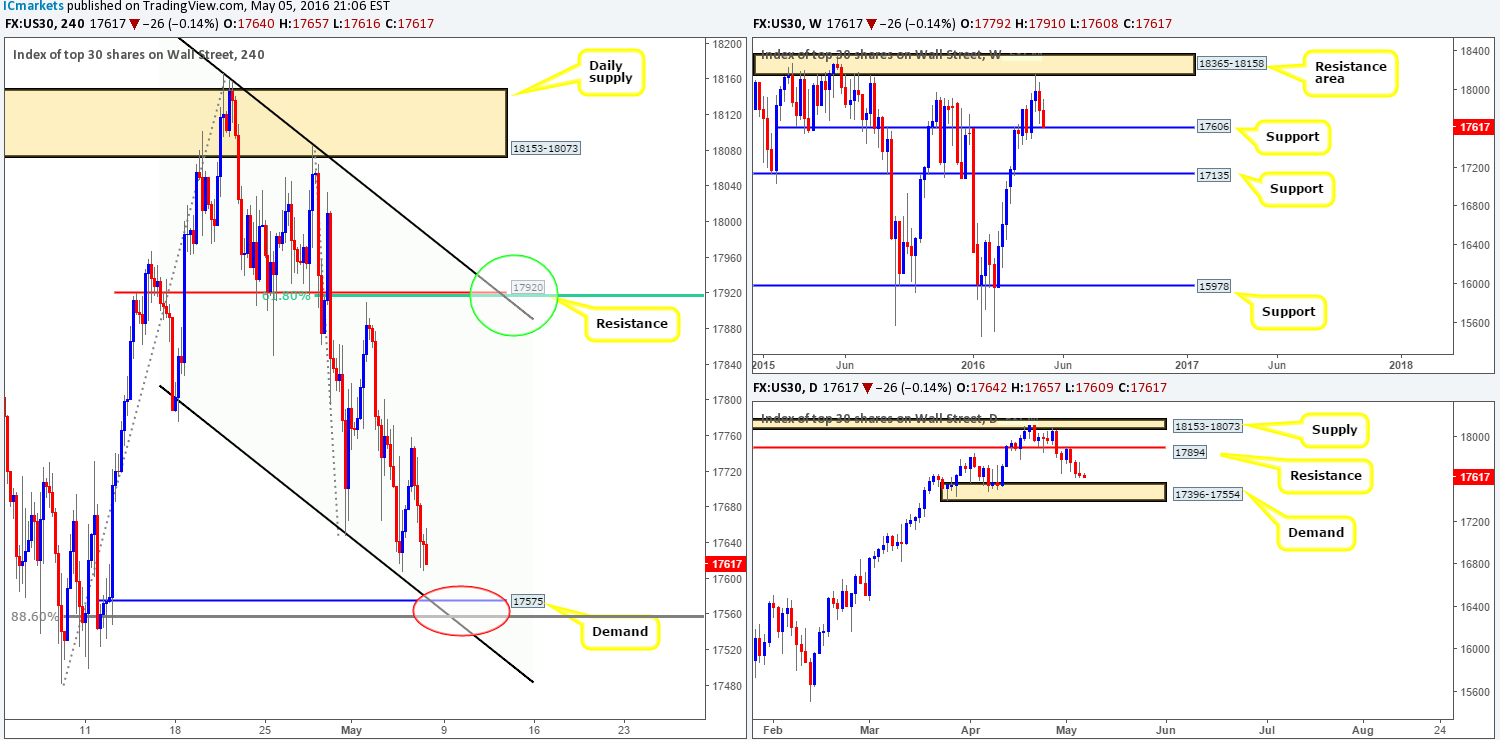
The DOW shows that early morning trade in London saw the unit sell-off from the 17759 mark yesterday – the high for the day. This, as you can see, brought the index to lows of 17609 by the close. In an attempt to keep this report short and sweet, let’s get right to the meat and potatoes! Over on the weekly chart, weekly support at 17606 is now in play, while lower down the daily chart price is seen trading within touching distance of daily demand penciled in at 17396-17554.
With the higher-timeframe structure logged in, H4 shows that the market is hovering just above H4 demand at 17575. Bolstering this level is a H4 channel support extended from the 17790 region, together with a deep 88.6% H4 Fibonacci support band at 17557 (red circle). Therefore, a long from 17575 at market is a valid trade call in our book. A pending buy order has been set at 17576 with a stop below the H4 channel support at 17518. In case the order does not fill prior to the NFP today, we’ll cancel and reassess following the report.
Levels to watch/live orders:
- Buys: 17576 [Pending order] (Stop loss: should be placed above the H4 descending channel support at 17518).
- Sells: Flat (Stop loss: N/A).
GOLD:
Technically, Gold is in a real tricky spot right now. Looking at the weekly chart, as we mentioned in previous reports, not only is weekly supply holding firm at 1307.4-1280.0, but over on the U.S. dollar index steady support is being seen around the 92.621 region. Contrary to this, nonetheless, daily action shows that the yellow metal is currently sandwiched between daily demand at 1270.8-1257.5 and daily resistance drawn from 1283.4, thus offering little direction from this timeframe. And finally, over on the H4 chart we can see that support at 1269.6 was recently brought into the action following a small, but rather aggressive sell-off yesterday.
With price now see trading mid-range between the aforementioned H4 support and the above said daily resistance, as well as the mighty NFP set to hit the spotlight later on, what levels are on our radar going into today’s sessions:
- H4 demand at 1252.9-1256.8 (sits just beneath the aforementioned daily demand area). What we like about this zone is it was formed from the break of a H4 QM resistance line seen marked with a red arrow at 1257.9. Waiting for lower timeframe confirmation to form before trading this area is advisable due to where price is positioned on the weekly timeframe (see above).
- H4 support at 1269.6 (effectively represents the top-side of the above said daily demand) has reacted once already so a retest of this line is a strong possibility (lower timeframe confirmation required).
- Daily resistance at 1283.4 (sits within the aforementioned weekly supply) is also somewhere a bounce could be seen from today. To avoid being whipsawed, however, we’d recommend waiting for lower timeframe price action to confirm that the sellers are awake.
Technicals will likely take a back seat once the employment numbers are released later on today, so trade with caution. Furthermore, for confirmation techniques which we’ll be using to trade the above areas please see the top of this report.

Levels to watch/live orders:
- Buys: 1252.9-1256.8 [Tentative – confirmation required] (Stop loss: dependent on where one confirms this area). 1269.6 region [Tentative – confirmation required] (Stop loss: dependent on where one confirms this area).
- Sells: 1283.4 region [Tentative – confirmation required] (Stop loss: dependent on where one confirms this area).